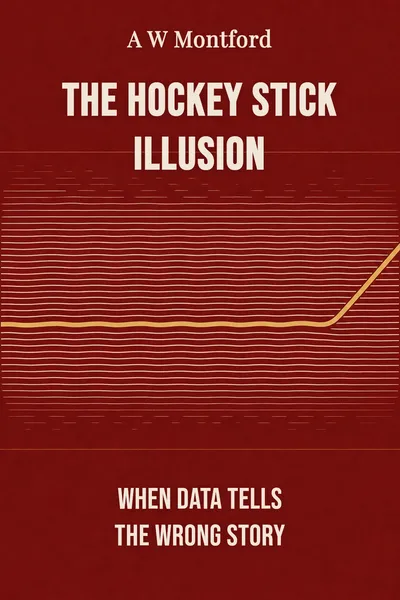
The Hockey Stick Illusion
When data tells the wrong story
Description
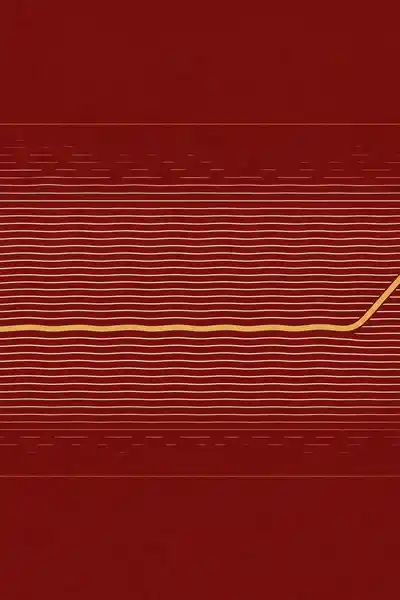
In 1998, a trio of climate scientists led by Michael Mann published a reconstruction of Northern Hemisphere temperatures stretching back six centuries, later extended to a thousand years. The picture it produced was arresting in its simplicity: a long, gently declining line — the shaft — followed by a sudden upward jerk in the twentieth century — the blade. A hockey stick. The graph suggested the recent warming was unprecedented in a millennium, and it travelled fast. Within four years it sat at the centre of the United Nations climate panel's 2001 report, reproduced six times, blown up behind officials at press conferences. Few images in modern science have carried so much argumentative weight so quickly.
A W Montford's book tells the story of what happened next — not from inside the laboratory, but from the vantage of a Canadian mining consultant named Stephen McIntyre, who looked at the famous curve and wanted to see the numbers behind it. What he found, in Montford's telling, was not a fraud in the obvious sense but something quieter and more unsettling: a statistical method that leaned toward producing hockey-stick shapes, data series doing far more work than their number warranted, and a research community strikingly unwilling to hand over the workings.
The book is less a treatise on the climate than a case study in how a scientific claim becomes unquestionable. It follows one long argument between an outsider with a spreadsheet and an establishment with a reputation to defend, and it asks what that argument reveals about the machinery of certainty itself.
The question we’re asking : How does a single graph become settled science — and what happens when someone asks to check the arithmetic?What we’ll see : The rise of an iconic curve, the statistics underneath it, and the long dispute over who gets to verify a result.
Table of contents
01 Chapter 1 — A curve that reshaped a debate
Before the hockey stick, the standard picture of the last thousand years included a warm stretch in the Middle Ages — the Medieval Warm Period, when Vikings farmed Greenland — and a cold spell known as the Little Ice Age, when the Thames froze hard enough to hold fairs. These features appeared in the climate panel's earlier reports. They mattered, because if the past had been as warm as the present without any help from industry, the recent rise looked less exceptional. The medieval warmth was, in that sense, an inconvenient hump.
Mann and his colleagues took a different route to the past. Rather than piecing together regional histories, they combined many so-called proxy records — tree rings, ice cores, coral — into a single statistical reconstruction of hemispheric temperature. The result flattened the medieval hump and the little ice age into a barely perceptible slope, then sent the modern era shooting upward. The message was clean: nothing in the previous millennium came close to what we are living through now.

02 Chapter 2 — The mathematics of a preordained shape
Stephen McIntyre's instinct came from a world where numbers are meant to be audited. Mining promoters produce charts that promise mineral riches; a careful reader checks whether the sampling was honest before trusting the shape. Applying that habit to the temperature reconstruction, McIntyre asked for the underlying data and the code, and began to reverse-engineer how the shaft and blade had been produced. Working later with the economist Ross McKitrick, he zeroed in on the statistical engine at the centre — a variant of a technique called principal components analysis.
The technique is a way of squeezing many wiggling records into a few summary patterns. Montford's account, following McIntyre, argues that the particular version Mann used was set up in a way that mined for hockey-stick shapes. The data had been centred not on the whole thousand-year span but on the twentieth century alone, which had the effect of hunting out any series that turned sharply upward at the end and promoting it to prominence. Fed random noise with no trend at all, the method still tended to spit out hockey sticks. The shape, in other words, could be an artefact of the arithmetic rather than a message from the past.
03 Chapter 3 — Following the paper trail
Much of the book is not about statistics at all but about the grinding effort to get hold of them. When McIntyre asked for data and methods, he often met delay, partial answers, or refusal. Some of this was ordinary — busy scientists, lost files, proprietary datasets held by third parties. But Montford builds a picture in which reluctance hardened into resistance, and requests that should have been routine became battles fought through journals, funding agencies, and eventually freedom-of-information laws.
The dispute escalated into official territory. In the United States, two separate reviews were commissioned to examine the reconstruction. One, chaired by the statistician Edward Wegman, was sharply critical of the methods and noted an insular network of co-authors reviewing one another's work. Another, by the National Research Council in 2006, was more emollient: it accepted that the specific statistical criticisms had merit and that confidence in the very oldest part of the record was low, while still concluding that recent warmth was plausibly unusual. The two reports were read, predictably, as vindication by both sides.
04 Chapter 4 — When gatekeeping becomes the story
Step back from the graph and a broader argument emerges, and it is really a sociological one. Montford's deeper subject is not tree rings but how a scientific community manufactures and then guards certainty. A result gains authority not only from being correct but from being repeated, endorsed by panels, and folded into the consensus that later citations rest upon. Once a claim reaches that status, the ordinary machinery of science — replication, challenge, revision — can quietly stall, because too much has been built on top of it for anyone to want it disturbed.
The mechanism he describes will be familiar to anyone who has studied how expert fields police themselves. Peer review, meant to be a filter for quality, can double as a boundary guard, deciding whose questions count as legitimate. Funding, prestige and career depend on being inside the circle, which raises the cost of dissent and lowers the appetite for handing critics the raw materials to attack you. An outsider like McIntyre, with no institutional standing and no stake in the reigning theory, is easy to dismiss as a nuisance — and hard to answer, precisely because he is asking the plain question of whether the numbers reproduce.
05 Conclusion
The graph that once stood six times over in a UN report has quietly lost its old prominence. Later reconstructions, using more data and more careful statistics, tend to show a modern rise while restoring some of the medieval warmth the original curve had flattened — a messier, more honest picture than one clean line. The blade survived; the perfectly straight shaft did not. Mann's reconstruction is now one result among many rather than the emblem it briefly became, which is roughly where a single study ought to sit.
Related books