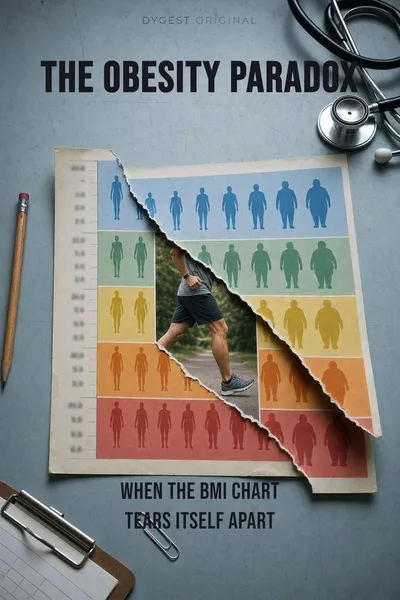
The obesity paradox
Why BMI may be measuring the wrong thing
Description
The number that most American adults can recite about their own bodies — their body mass index, the BMI calculated by dividing weight in kilograms by height in meters squared — was invented in 1832 by a Belgian astronomer and statistician named Adolphe Quetelet. Quetelet was not a physician. He had no interest in individual health. He was a pioneer of social statistics, attempting to identify regularities in human populations the same way he identified regularities in stellar movements, and the formula he developed was intended to characterize the “average man” of a population rather than to evaluate any specific person. The index was published in his 1832 paper “Sur l’homme et le développement de ses facultés.” It sat in the demographic literature for over a century without attracting clinical attention. The American Insurance industry rediscovered it in the 1940s, the World Health Organization adopted it as a screening tool in the 1990s, and by the 2000s, the BMI had become one of the most universal numerical labels attached to individual human bodies. The label has continued to operate as the standard despite the accumulated evidence that what Quetelet had designed for population statistics works badly as an individual diagnostic.
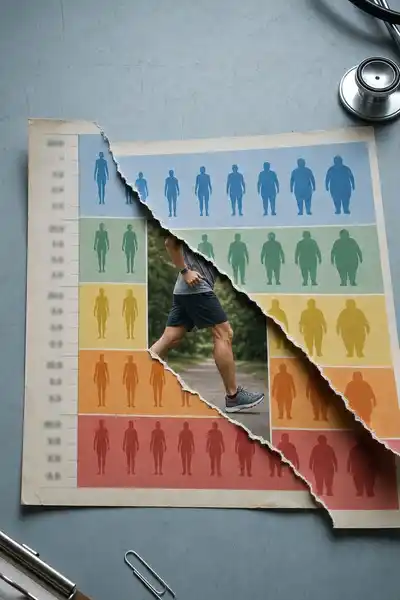
The accumulating evidence has produced what the medical literature now calls the obesity paradox — a pattern in which patients classified as “overweight” by BMI standards have, in several specific conditions, lower mortality than patients classified as “normal weight.” The pattern was first identified in cardiovascular research in the 1980s and has been replicated across diabetes, heart failure, kidney disease, certain cancers, and the elderly population generally. The 2013 meta-analysis by Katherine Flegal and colleagues at the CDC, published in JAMA, pooled data from over 2.88 million adults across 97 studies and found that the BMI category 25-30 (officially “overweight”) was associated with the lowest all-cause mortality, with the BMI category considered “normal” producing modestly higher mortality. The finding was contested then and remains contested now. The contestation has not produced a clear refutation. It has produced, instead, a substantial argument about whether the categorical framework BMI imposes on human bodies is doing the medical work the framework was assumed to do.
The deeper question the obesity paradox raises is whether BMI is measuring the thing it is supposed to measure. The metric does not distinguish between muscle and fat. It does not account for where fat is distributed, which has substantially stronger predictive power for cardiovascular and metabolic outcomes than total weight. It does not adjust for age, sex, ethnicity, or fitness, all of which substantially modify the relationship between weight and health. The medical use of BMI as a primary diagnostic tool has continued partly because the index is simple and reproducible, partly because alternative measures are more expensive or less standardized, and partly because the cultural authority of the BMI number has accumulated over decades in ways that have made it difficult to displace.
The question we’re asking: where did BMI actually come from, what does the research now say about its usefulness, and what does the obesity paradox reveal about the limits of population statistics applied to individual bodies?
What we’ll see: Quetelet and the Belgian statistical project, the migration of BMI into clinical medicine, the paradox and the alternative measures, and what survives.
Table of contents
01A Belgian astronomer and the average man
Adolphe Quetelet had been born in Ghent in 1796 and trained in mathematics and astronomy before becoming director of the Royal Observatory in Brussels in 1828. His central interest was the application of statistical methods to human populations. He believed human characteristics would show regular distributions, and that the regularities would reveal underlying laws of social organization. The Quetelet Index, later renamed Body Mass Index, was one of several statistical tools he developed.
The formula was elegant. Quetelet observed that adult weight tended to scale with the square of height rather than the cube that simple geometric scaling would predict. The ratio of weight in kilograms to height in meters squared produced a number that varied within a fairly narrow band across healthy adults, useful for identifying outlier populations. The purpose was demographic comparison, not individual evaluation.
02From population statistic to clinical category
Ancel Keys’s 1972 paper concluded that BMI was the most reliable of the available simple indices for distinguishing fat from lean mass at the population level. The paper recommended BMI for epidemiological research rather than for individual diagnosis. Keys himself was clear that BMI worked best for comparing populations and should not be the primary basis for clinical decisions about specific patients. The recommendation was not entirely heeded.
The migration into clinical medicine accelerated in the 1990s. The WHO’s 1995 report established the BMI categories — underweight (<18.5), normal (18.5-25), overweight (25-30), obese (30+) — that have remained the global standard. The thresholds were drawn from epidemiological associations in studies of mostly white European populations and have not been adjusted for the ethnic variation in body composition subsequent research has documented.
03The paradox and the alternative measures
The obesity paradox emerged from cardiovascular research in the early 1990s. Cardiologists studying patients with chronic heart failure noticed that patients classified as overweight by BMI standards had lower mortality than patients classified as normal weight, even after adjusting for known confounders. The finding was unexpected. The standard model of obesity and cardiovascular disease predicted that higher weight would produce higher mortality, but the data showed the opposite pattern in the specific population of heart-failure patients. The pattern was initially treated as an anomaly.
The 2013 Flegal meta-analysis extended the pattern to the general population. The CDC team analyzed mortality data from over 2.88 million adults across 97 studies and found that, after adjustment for age, sex, and smoking status, the BMI category 25-30 was associated with the lowest all-cause mortality. The “obese class I” category (BMI 30-35) showed no significant excess mortality over the normal range. Only “obese class II and III” (BMI above 35) showed clearly elevated mortality. The findings produced substantial controversy. Critics argued that the analysis was confounded by reverse causation — illness causing weight loss rather than the reverse — and by inadequate adjustment for smoking. Defenders argued that the analysis had used standard methods and that the pattern was robust to the proposed confounders.
04What survives, and what the measure was actually for
The BMI continues to operate as the dominant clinical measure of body composition despite its limitations as an individual diagnostic. The persistence is institutional — embedded in electronic medical records, billing codes, public-health reporting — and cultural. The number has accumulated authority over five decades of clinical use.
The deeper lesson is about the migration of measurement tools across contexts. Quetelet’s formula was designed for population statistics. The application to individual diagnosis is a different task, and the formula does not perform as well. The migration happened gradually across the twentieth century and was completed before its limitations had been documented.
The obesity paradox is less a paradox than a symptom of the framework being applied beyond its useful range. The BMI categories do not actually capture the clinically meaningful variation in body composition. Patients in the overweight category include people with high muscle mass, people with average composition and slightly elevated weight, and people with substantial visceral fat — three populations with very different health profiles that BMI cannot distinguish. The aggregate mortality reflects the mixture, partly because the “normal”category includes substantial numbers of patients whose low weight reflects undiagnosed illness.
05Conclusion
Adolphe Quetelet died in Brussels in 1874, having spent his career building the foundations of modern social statistics. He did not live to see the index he had developed for population analysis become a personal label for hundreds of millions of individual people. Ancel Keys, who renamed the index in 1972, also did not anticipate the extent to which the renaming would migrate the metric from epidemiological tool to individual diagnostic. The clinical adoption that followed was substantially broader than either Quetelet or Keys had recommended.