
The Keeling family
Three generations measuring the atmosphere
Description
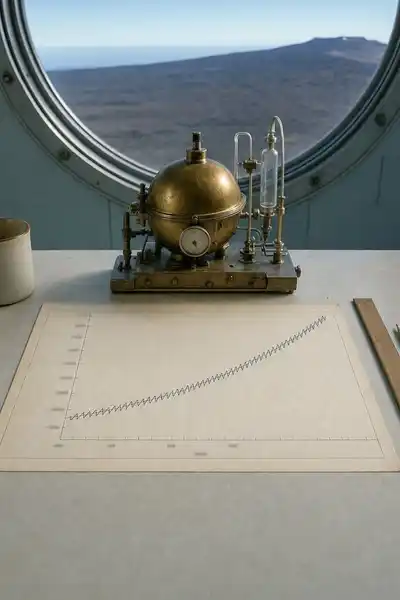
In March 1958, a twenty-nine-year-old geochemist named Charles David Keeling installed an analytical instrument called a non-dispersive infrared gas analyzer at the newly established Mauna Loa Observatory on the northern slope of the largest volcano on the Hawaiian island of Hawaii. The instrument was designed to measure the concentration of carbon dioxide in the atmosphere with substantially higher precision than any previous instrument had been capable of. The site had been chosen by Keeling for its distance from any major source of industrial or biological carbon dioxide emission, with the surrounding Pacific Ocean providing what he understood as the cleanest possible sample of the global background atmosphere. The first measurement read 313 parts per million. Keeling and his colleagues began taking continuous measurements at the site and would continue to do so, in a sequence that has now extended across nearly seven decades and across three generations of the same family, producing what has become one of the most consequential single datasets in the history of climate science.
The Mauna Loa carbon dioxide record — the so-called Keeling Curve — has documented the increase of atmospheric CO2 from the 1958 baseline of 313 parts per million to the 2025 measurement of approximately 425 parts per million, an increase of roughly 36 percent across the measurement period. The curve has become the central single piece of evidence in the scientific case for human-caused climate change, the foundational dataset that the entire field of climate science has been built around, and one of the most widely reproduced scientific charts in the history of the discipline. The implications for global policy, energy infrastructure, economic development, and the long-term habitability of the planet have been substantial. The dataset has continued to be maintained by Charles Keeling’s son Ralph Keeling, who took over the program after his father’s death in 2005 and who has continued to direct it from the Scripps Institution of Oceanography in La Jolla, California. The grandson, Eric Keeling, has also been involved in atmospheric science research, with the family’s direct involvement in climate measurement now extending across three generations.
The case has become one of the standard examples in the history of science of how a single sustained measurement program, conducted with unusual rigor over an unusual length of time, can produce evidence that fundamentally reshapes a scientific field and the broader public conversation. The Keeling Curve was not anticipated by the scientific community when Charles Keeling began the measurements. The expectation had been that atmospheric CO2 would fluctuate around a stable baseline. The discovery that it was steadily and substantially increasing was unexpected, and the subsequent four decades of measurements were the evidence base on which the global climate consensus was substantially built.
The question we’re asking: what did Charles Keeling actually measure, why has the dataset been so consequential, and what does the case reveal about how scientific evidence interacts with public policy?
What we’ll see: the 1958 Mauna Loa installation and the early measurements, the discovery of the upward trend, the policy consequences, and what survives.
Table of contents
01Mauna Loa, 1958
Charles David Keeling completed his PhD in chemistry at Northwestern in 1954 and took a postdoctoral position at Caltech with the geochemist Harrison Brown. His research project across the mid-1950s was the development of an analytical method for measuring the partial pressure of CO2 in air and water samples with the precision required to detect small differences between sites. The instrument he developed could measure CO2 to within roughly 0.1 parts per million, an improvement of approximately two orders of magnitude over previous methods.
The 1957 International Geophysical Year provided the funding and institutional structure for the program Keeling proposed. The Scripps Institution of Oceanography, where Keeling had taken a position in 1956, became its institutional home. Two measurement sites were selected — Mauna Loa for its isolation from industrial sources, the South Pole for its representativeness of the southern hemisphere atmosphere.
02The curve and the discovery of the trend
The Keeling Curve, as the published chart of the Mauna Loa measurements came to be called, became one of the most consequential charts in the history of science. The visual representation — the steady upward sawtooth that combined the seasonal oscillation with the underlying trend — communicated the central finding more effectively than any verbal account would have. The chart has been reproduced in thousands of scientific publications, in IPCC reports, in textbooks, and in the broader public conversation about climate change. The visual recognition has been substantial enough that the chart has become one of the standard cultural symbols of the climate question.
The scientific interpretation was developed across the 1960s and 1970s. The Swedish meteorologist Bert Bolin, who would later become the first chair of the IPCC, was among the early researchers who recognized that the increasing CO2 concentration would produce warming through the greenhouse effect that had been theoretically described by Svante Arrhenius in 1896. The connection was substantially established by the late 1970s, with the 1979 Charney Report by the U.S. National Academy of Sciences providing the first major institutional assessment that doubling CO2 would produce global warming of 1.5 to 4.5 degrees Celsius.
03The policy consequences
The policy consequences of the Keeling dataset have been substantial but slower than the scientific case would have suggested. The 1979 Charney Report and the subsequent series of National Academy assessments established the scientific consensus that human emissions were producing global warming, but the policy response was substantially slower than the scientific consensus would have implied. The 1988 testimony by NASA scientist James Hansen before the U.S. Senate, in which Hansen explicitly drew on the Mauna Loa measurements and the projected warming trajectories, marked the beginning of substantial public awareness. The 1992 Rio Earth Summit produced the United Nations Framework Convention on Climate Change, with the Keeling Curve serving as one of the central pieces of evidence in the negotiations.
The Kyoto Protocol of 1997 and the Paris Agreement of 2015 represented the principal international policy responses. The empirical record across these agreements has been one of continued increase. The Mauna Loa measurements at Kyoto were approximately 363 ppm. Paris was at approximately 401. The 2025 measurement is approximately 425. The international response has modified the trajectory of emissions in specific countries and sectors, but the global atmospheric trend has continued to operate.
04What survives, and what the case shows
The Keeling Curve has continued to operate as one of the central pieces of evidence in the contemporary climate conversation. The dataset has been extended through reconstruction of pre-industrial CO2 concentrations from air bubbles preserved in Antarctic ice cores, with the resulting record extending across approximately 800,000 years. The pre-industrial range has been documented as 180 to 280 parts per million, with the contemporary value of 425 representing the highest atmospheric CO2 concentration in at least two million years and possibly substantially longer. The implications for the climate system are substantial enough that the contemporary CO2 level is operating outside the range that the climate system has experienced across the entirety of the period during which humans have existed as a species.
05Conclusion
Charles David Keeling died in 2005 at the age of seventy-seven. He had spent his last years continuing to advocate for the institutional support of the Mauna Loa program and continuing to work on the scientific interpretation of the long-term dataset. Ralph Keeling has continued to direct the program from Scripps and has continued to publish updated analyses of the long-term trajectory.